

Software project reports - sprint, flow and cycle time
The Reports tab shows how a software project is performing. Three built-in reports cover sprint progress, where work is piling up, and how long issues take to finish. You can also save custom reports for the views your team asks for most.
At a glance
| What it is | Built-in Sprint, Flow and Cycle time reports plus saved custom reports |
| Where to find it | Software project, Reports tab |
| Who can see it | Owner/Admin, Project Manager and Member. Guests do not see the tab. |
| Plan | Same on every plan |
If you have not started a sprint yet, the tab shows No started sprints yet. Start one from the Backlog first. See sprints.
What does the Sprint report show?
Use the sprint selector to pick a sprint. The active one is marked (active). The header shows the goal, the dates and, for finished sprints, the completion date.
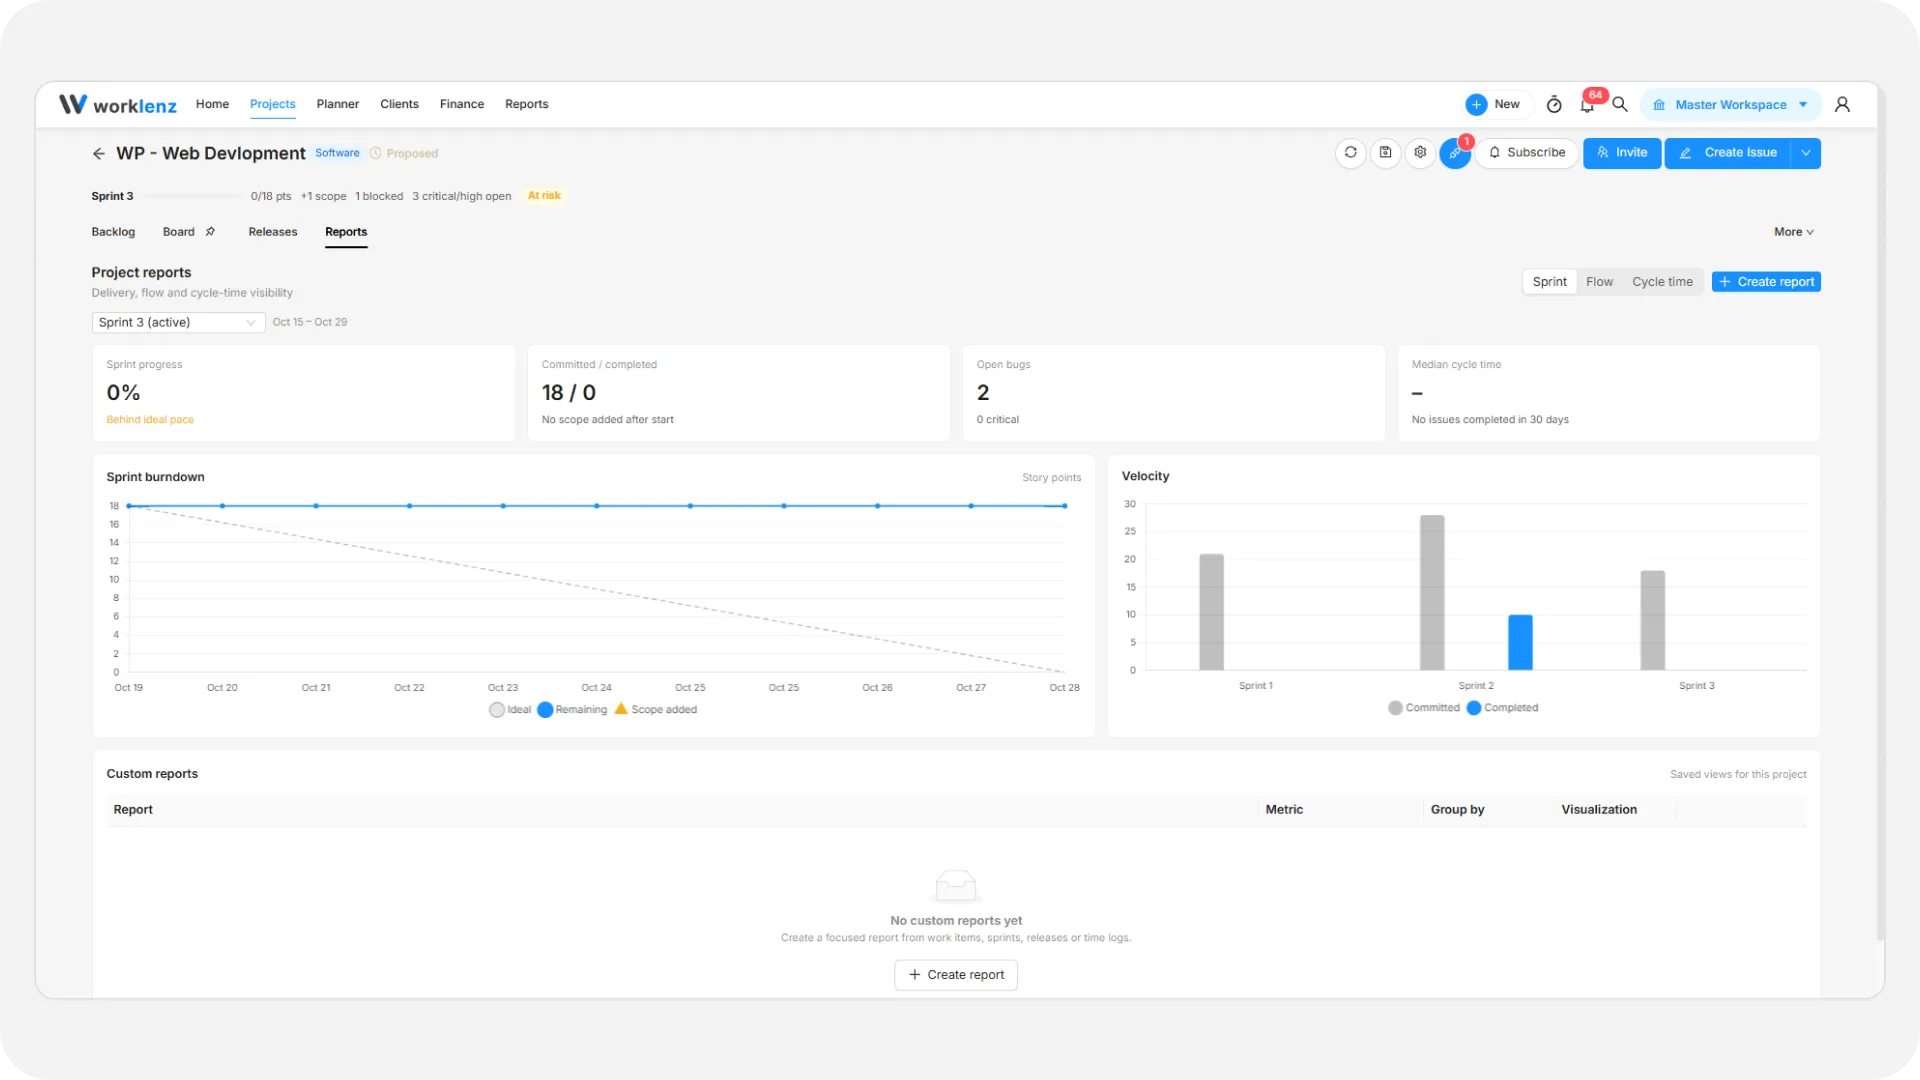
- Sprint progress - issues done out of total, and whether you are behind or on or ahead of the ideal pace.
- Committed / completed - points planned at the start against points finished. An Estimated badge means the sprint began before scope tracking, so committed points are estimated from its current scope. It also notes points added after the start.
- Open bugs - how many, and how many are critical.
- Median cycle time - over the last 30 days, compared with the 30 days before.
- Sprint burndown - story points left each day. The Ideal line slopes down evenly; Remaining is what is actually left. A Scope added marker shows when work joined mid-sprint. Set sprint dates, or the chart stays empty. It covers up to 90 days.
- Velocity - Committed against Completed points for your last 6 sprints. Complete a sprint to see it.
What does the Flow report show?
Flow looks at the active sprint. With no active sprint it shows the whole project and says so.
- Current flow distribution - a bar of issues in each status. A tall bar in the middle of your workflow is a queue.
- Work in progress - issues in in-progress statuses.
- Largest queue - the status holding the most issues.
- Blocked - issues flagged as blocked. It reads “Nothing blocked” when clear.
- Throughput - issues finished in the last number of days, compared with the period before.
What does the Cycle time report show?
Cycle time is measured from when an issue first moves to in progress until it is done. Shorter and steadier is better.
- Cycle time trend - the weekly median over the last 12 weeks.
- Median cycle time and 85th percentile - the typical case, and the slow end that 15% of issues exceed.
- Oldest active item - the issue that has been in progress longest.
- Reopened - issues reopened in the last 30 days.
How to build a custom report
- Open the Reports tab and click Create report. You can also use the button in the empty Custom reports list.
- Report name - required, up to 100 characters.
- Data source - choose Work items, Sprints, Releases or Time logs.
- What to measure - choose a Metric and a Group by. The options depend on the source (table below).
- Filter - All work, Active sprint, Bugs only or Blocked only. Filters apply to work items and time logs only.
- Display and sharing - pick a Visualization: Bar chart, Line chart, Donut chart, Table or KPI. Set Visibility to Project or Private.
- Watch the Preview panel update as you change options, then click Save report.
| Source | Metrics | Group by |
|---|---|---|
| Work items | Work item count, Story points, Cycle time, Blocked work items | Assignee, Status, Epic, Priority, Work type, Sprint, Release |
| Sprints | Committed points, Completed points, Completed work items | Sprint |
| Releases | Work item count, Completed points | Release |
| Time logs | Time logged | Same as Work items |
A saved report appears under Custom reports. Each row has Open, an export-to-CSV icon, and Delete. Inside an open report, Export CSV and Done are at the bottom.
Who can see custom reports?
Project visibility means everyone with access to the project’s tasks can open the report. Private means only you. The creator, or a workspace Owner/Admin, can delete a report.
Example
Before sprint review you create a work-items report grouped by Assignee, measuring Story points, filtered to Active sprint, shown as a bar chart. You save it as Project visibility so the whole team opens the same view.
Best practices
- Set sprint dates and estimate issues before you start a sprint, because the burndown chart stays empty without dates and committed points are recorded at start.
- Complete your sprints, because the velocity chart compares committed and completed points only for finished sprints, up to the last 6.
- Watch the 85th percentile as well as the median on the Cycle time report, because it shows the slow end that 15% of issues exceed.
- Set shared custom reports to Project visibility and personal experiments to Private, because Project reports can be opened by everyone with access to the project.
- Group custom reports by a field with few values, because a custom report shows up to 50 rows.