

Finance overview
The Finance overview dashboard provides a consolidated financial summary of all projects in your workspace. It helps you monitor overall spending, compare budgets against actual costs, track currency conversions, and spot over-budget projects early.
How to Access
- Click Finance in the top navigation bar.
- In the left sidebar, click Overview.
Financial KPI cards
The top metric cards give an executive summary rolled up across all projects:
- Total Manual Budget: Combined planned budget across projects.
- Total Actual Cost: Realized expenditure calculated from logged billable hours and expenses.
- Total Variance: Difference between budget and actual cost (negative variance in red indicates budget overrun).
- Budget Utilization: The overall percentage of budget consumed so far.
- Estimated Hours: Total estimated working hours allocated across all projects.
Currency Conversion: Totals are converted using live exchange rates. Click Change currency to switch your display currency. If exchange rates cannot be loaded, the totals are not converted and you can use Check currency settings.
Project financial health table
The central table breaks down the financial status of each project:
- Project: Name of the project.
- Client: Linked client for the project.
- Manual Budget: Planned budget allocated to the project.
- Actual Cost: Cumulative cost incurred to date.
- Variance: Remaining budget (green) or budget deficit (red).
- Budget Utilization: Percentage of the project’s budget spent.
- Est. Hours: Estimated duration planned for the project tasks.
- View Button: Direct shortcut opening the full Finance tab inside that specific project.
Search and Export
- Search Projects: Filter the table by typing a project name.
- Export as Excel: Click Export as Excel to download a spreadsheet of the table. Worklenz confirms with “Exported Successfully.” or reports “Export Failed.”
Sidebar widgets
Projects Needing Attention
- Lists projects that are in the Watch or Over budget range, each with the percentage of budget spent. When none qualify, the panel reads “All projects are within budget.”
Budget Status Distribution
A donut chart categorizing all workspace projects into three health tiers:
- On track: Projects with 65% or less of budget spent.
- Watch: Projects with 65-100% of budget spent.
- Over budget: Projects above 100% of their planned budget.
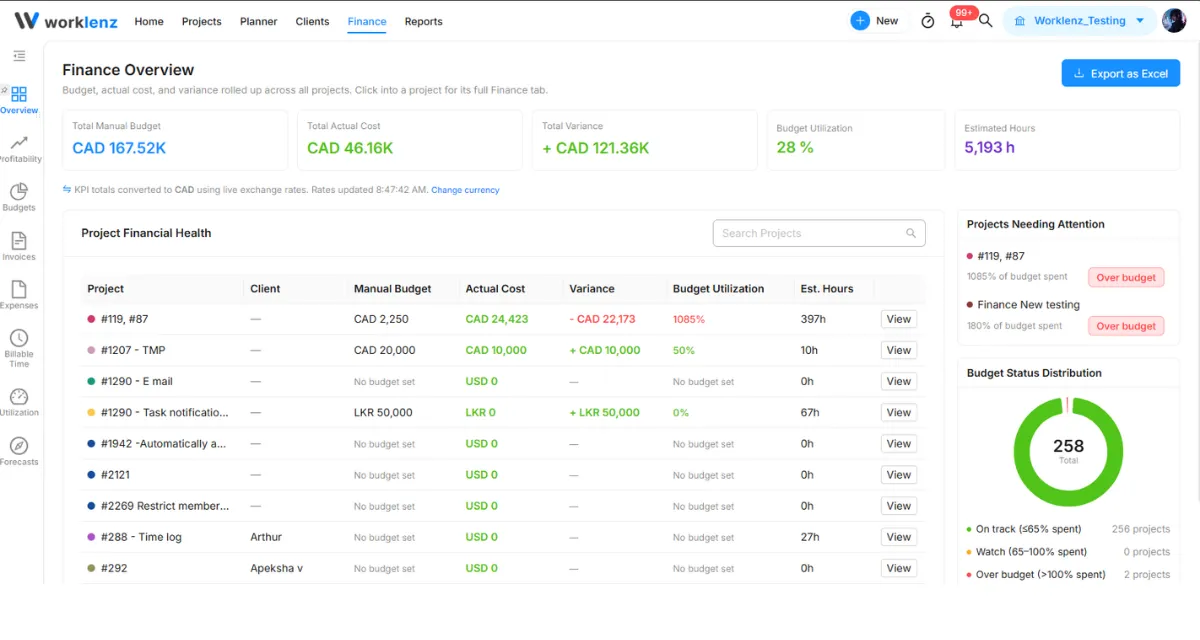
The chart also shows the total number of projects and a breakdown of actual cost into fixed and time-based amounts.
Other finance reports
The Finance section has more portfolio views beyond the Overview:
- Profitability for revenue, cost, and margin.
- Budgets for burn rate across projects.
- Invoices for invoiced, paid, and outstanding amounts.
- Billable time for logged hours and their value.
- Utilization for billable hours against capacity.
- Forecasts for projected revenue and profit.
Best practices
- Set a budget on every project, because projects without one show “No budget set” and cannot be judged on budget status.
- Review Projects Needing Attention regularly, because it lists projects in the Watch range (above 65% spent) before they go over budget.
- Keep projects in one currency where you can, because mixed currencies without conversion produce totals that are not comparable.